Dashtera
Create no-code dashboards with real-time data, GPU-powered charts, and drill-down analytics
Overview
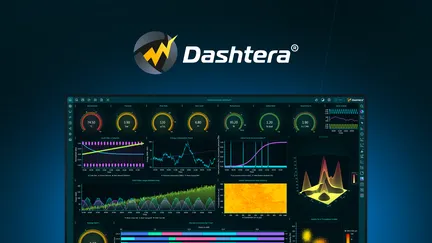
Dashtera is a no-code data analytics and dashboard platform built around high-performance, GPU-accelerated visualizations and real-time data connectivity. It’s designed to remove engineering bottlenecks by letting analysts, product managers, researchers, and operations teams connect SQL, NoSQL, streaming feeds, and flat files to an intuitive drag-and-drop dashboard editor. Under the hood, WebGL-based rendering and a library of advanced chart types let you visualize very large datasets smoothly in the browser while supporting interactive exploration like drill-throughs and multi-level drilldowns.
The platform positions itself as a bridge between lightweight spreadsheets and heavyweight BI systems: it supports live streaming, large time-series datasets, and engineering or scientific visualizations while keeping the setup and dashboard design largely code-free.
Key features
- Real-time, GPU-accelerated rendering: WebGL charts and maps that update with streaming sources and large datasets with minimal lag. Built to handle high-frequency data and tens of millions of points on screen.
- No-code drag-and-drop dashboard editor: Build and arrange panels, mix chart types, and configure interactions without writing SQL or scripts.
- Wide chart library: 90+ chart types including basic (bar, line, scatter), XY, polar, surface/3D, candlesticks and other technical analysis charts, elevation maps, and specialized engineering/science charts.
- High-performance maps: Interactive WebGL maps for geographic visualization with fast pan/zoom and the ability to render many geospatial points.
- Financial & trading tools: Candlestick charts, overlays, multi-series indicators, and 100+ technical indicators plus 30+ drawing tools for annotations and technical analysis.
- Extensive connectors: Direct connections to PostgreSQL, MySQL, SQL Server, MongoDB, InfluxDB, common streaming sources, and file imports (CSV, JSON, XML, Excel). Also supports external services and URL-based imports.
- Data preprocessing and transformations: Built-in column operations (add, subtract, count, sum, etc.) to preprocess datasets inside the platform before visualizing.
- Drill-down and drill-through analytics: Navigate from summarized KPIs down to individual records or transaction-level details with linked views.
- Export and sharing: Share dashboards via secure links or export as PDF and PNG for reporting or archival.
- Deployment flexibility: Options for cloud, on-premises, hosted private deployments, white-label/OEM, and enterprise source-code access for custom integrations.
- Collaboration and sharing controls: Publish dashboards publicly or share securely with team-level permissions and link-based access.
Strengths
- Performance-first approach: The combination of GPU acceleration and WebGL rendering is the standout advantage. Dashboards that would typically bog down in browser-based BI tools run smoothly here, especially for real-time and high-density visualizations.
- Rich visualization surface: Support for >90 chart types plus advanced 3D/engineering charts and geospatial rendering makes it suitable for specialized use cases beyond standard business dashboards.
- No-code accessibility: Non-developers can build complex, interactive dashboards quickly thanks to a polished drag-and-drop editor and built-in data transformations.
- Real-time streaming support: Native handling of live streams and frequent updates is valuable for IoT, monitoring, and trading workflows where stale data is unacceptable.
- Domain versatility: The platform covers business intelligence, finance/trading, IoT and industrial monitoring, and scientific/engineering visualization—reducing the need for multiple tools.
- Strong technical-analysis toolkit: Traders and analysts get a serious set of indicators and drawing tools which is uncommon in many general-purpose BI systems.
Weaknesses and considerations
- Learning curve for advanced features: While the basic editor is approachable, mastering real-time pipelines, drill-through navigation, and complex visualizations may require time and familiarization.
- Connector and integration depth: Common databases and file types are supported, but enterprise teams should validate connector authentication, incremental sync, and custom connector needs for their stack.
- Resource considerations for large deployments: GPU-accelerated rendering benefits client-side performance, but server infrastructure and streaming ingestion scaling should be planned for at enterprise scale.
- Feature parity and roadmap details: For very specific enterprise features (fine-grained RBAC, audit logs, SSO integrations, automated CI/CD of dashboards), prospective users should confirm roadmap and enterprise deployment options.
Who it’s best for
- Data analysts and BI teams who need fast, interactive dashboards without depending on engineers for queries and embedding.
- Operations and SRE teams monitoring streaming telemetry, sensor data, and industrial automation metrics that require real-time visualization.
- Financial analysts and traders who need technical analysis charts, live market feeds, and interactive drill-downs.
- Engineering and research teams that work with large scientific datasets, 3D surface plots, and complex visual representations.
- Organizations that want a flexible deployment model (cloud or on-premises) and the option to white-label or integrate visualization tech into their product.
Bottom line
Dashtera stands out by delivering high-performance visual analytics with a user-friendly, no-code approach. Its GPU-backed rendering and broad chart library make it a compelling choice when you need smooth, real-time dashboards that can handle dense or streaming data—especially in finance, IoT, engineering, and scientific domains. Teams evaluating dashboard tools should prioritize testing their own data volumes and streaming scenarios to verify connector behavior and deployment fit, but for fast exploration of live, large-scale datasets, Dashtera is a strong candidate that narrows the gap between specialized visualization engines and accessible dashboard builders.